Enter how dark the test line looks next to the control, add your date or DPO, and we will plot your line progression. You will see a simple trend, a projected day your test may match the control, and a rough hCG trend estimate for context.
Pregnancy Test Line Progression Checker
What this tool does
- Lets you record multiple home pregnancy tests with date and time (or DPO), brand, hydration or time of day, and an estimated test line darkness relative to the control line.
- Plots every point on a unified X axis, draws a connecting line, and labels each point.
- Classifies the short-term trend using pairwise comparisons, then gives a plain language pregnancy verdict that considers positivity, trend, and latest strength.
Inputs and normalisation
- Brand detection threshold is approximated with a limit of detection value per brand. Example values in this build: 6.3, 10, 20, 25 mIU/mL.
- Dilution factor adjusts for timing or hydration. First morning is 1.00. Morning non-FMU is 0.90. Afternoon or evening is 0.80. Heavy hydration is 0.65.
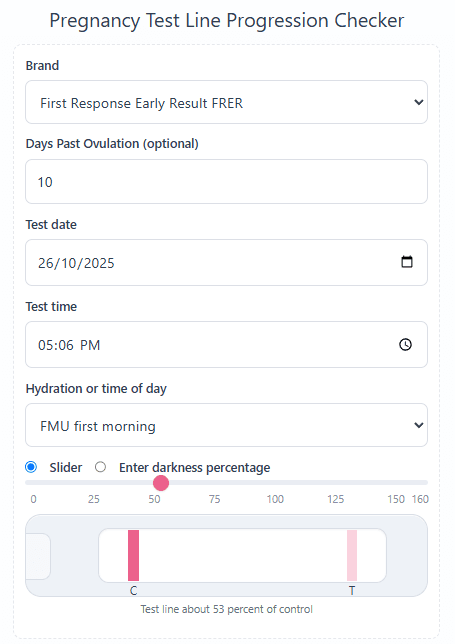
- Darkness percent is the user estimate of test line relative to the control line from 0 to 160. Zero means no visible test line. One hundred equals the control. Above one hundred models dye-stealer effects.
- Normalization for each point is:The plotted value isscore from darknessgamma curve up to one hundred, then a mild overshoot curve above one hundredbrand factorscaled by 10 divided by brand limit of detectiondilution factoras selected from the hydration list
norm = darkness_score × dilution_factor × (10 / LOD). The approximate detection line isthreshold = 1.0 × dilution_factor × (10 / LOD).
Time axis
- If you supply ovulation, the X axis is DPO from that date.
- If not, and at least one test has both date and DPO, the tool infers ovulation by back-calculating a median origin.
- Otherwise it uses days since the first dated test. If only indexes are available, it uses test order.
Trend classification
- Eligible points must be above a floor near the per-test detection threshold.
- Pairs are built where the gap is about one to three and a half days on DPO scales. The window is wider when only test indexes are available.
- Each pair contributes a change ratio. Mixed brands and mixed hydration reduce the weight of a pair.
- The median of log-ratios across pairs drives the label:
- Compatible with rising hCG when the median ratio is at least 1.20.
- Falling compared with earlier test when the median ratio is at most 0.90.
- Plateau or minimal change otherwise.
- Confidence starts at a base value and is adjusted up with more pairs, and down with high dispersion, brand mixing, or hydration mixing. It is capped when there are only two or three eligible points.
Optional curve fit and projection
- When there are at least three eligible points on a true time axis, the tool fits an exponential curve on log scale by least squares.
- If the fitted growth rate is positive, the implied doubling time is between nineteen and ninety six hours, and the fit is adequate, the tool projects the day the test may match the control line.
- Projection is approximate. It will not show when the data are too noisy, sparse, or inconsistent.
Pregnancy verdict
- Combines the count of above-detection positives, the trend label, and how strong the latest point is relative to its detection line.
- Outputs a qualitative category and an estimated percentage. This is a heuristic score, not a diagnostic probability.
Design notes and guards
- Brand values and dilution factors are pragmatic defaults. Real strips vary by lot, lighting, camera, and viewing conditions.
- Trigger shots can cause early positives for about ten to fourteen days. Use the trigger inputs to flag that context.
- Dye-stealer effects are handled by allowing percentages above one hundred with a gentle colour shift.
Limits
- Home tests are qualitative screens. Line darkness is not a precise assay.
- Different brands, different hydration, and different times of day reduce comparability across points.
- This tool is educational. For medical decisions use quantitative serum hCG and ultrasound with clinical guidance.
Sources are provided in the separate “Sources” section on this page.
Last updated: 28 Oct 2025
How to use this tool
- Add your tests: Use “Add another test” to list each strip or cassette you took.
- Enter timing: Add the test date and time or Days Past Ovulation. Either works.
- Pick brand and hydration: Select the test brand and when you tested, for example first morning urine.
- Set line darkness: Use the slider or enter the test line as a percentage of the control line. Zero means no visible line.
- Open Advanced options if you want to record a trigger shot date and time or set an ovulation date to auto-fill DPO.
- Run the check: Select “Check My Trend”. Your points are charted with a connecting line and a fitted curve where possible.
Tip: Use the same brand and similar hydration for the clearest trend. Aim for about forty eight hours between tests.
What the chart shows
- Your points: Every test you entered is plotted. Labels show “Test 1”, “Test 2”, and so on.
- Connecting line: A thin line links your points to make the visual trend easy to follow.
- Fitted curve: When there are enough above-detection points, a curve is fitted to estimate growth.
- Threshold line: A dashed line marks the typical control-match threshold after adjusting for brand and hydration.
- Projection: With a clear rise, the tool estimates when your test may match the control and shows an implied doubling time.
Tips for clean inputs
Keep brands consistent
Mixing brands can reduce comparability. If you change brand, note it in the inputs.
Match hydration
First morning urine is usually less diluted. Afternoon or heavy fluids can lighten lines.
Space tests
Leave about forty eight hours between tests for clearer changes in early pregnancy.
Record DPO or dates
Either is fine. Setting ovulation lets the tool build a DPO axis automatically.
- Human Chorionic Gonadotropin (StatPearls, NCBI Bookshelf). Overview of hCG physiology, detection, and clinical interpretation.
- Serum human chorionic gonadotropin levels throughout normal pregnancy (American Journal of Obstetrics and Gynecology, 1976). Classic reference charting hCG levels across gestation; used here for context on early positivity and trend expectations.
Pregnancy test line progression: FAQs
How do I record line darkness correctly?
Use the slider or type a number. Zero means no visible test line. One hundred means the test line looks as dark as the control. Values above one hundred (up to one hundred sixty) mean darker than control, often called a dye stealer.
What counts as “above detection” in the model?
The tool estimates a detection level from the brand sensitivity and hydration setting. Very faint entries under that level are still charted, but they are not used to judge the rise or to fit a projection.
Why can some of my points be excluded from modelling?
Common reasons: at or below detection for the brand and hydration, no usable timing (no date or DPO), or gaps that are too short or too long to compare. Excluded points remain visible on the chart for context.
How is the “trend verdict” decided?
The tool compares pairs of eligible tests roughly one to three days apart and takes a robust median of the ratios. A rise of about twenty percent or more is classed as “compatible with rising hCG”. A fall of about ten percent or more is classed as “falling”. In-between looks like a plateau or minimal change.
How many points do I need for a projection?
At least three above-detection points with reasonable spacing. Using the same brand and similar hydration improves the fit. With fewer points you will still see the trend verdict, but no projection line.
Can I mix brands or test at different times of day?
You can, and all points will plot, but mixing brands and hydration reduces comparability. For clearer trends use the same brand and similar timing, for example FMU, and avoid heavy fluids beforehand when possible.
What does the “pregnancy verdict” percentage mean?
It is a heuristic that combines how many tests are above detection, the latest line strength relative to its threshold, and the direction of the trend. It is a visual guide only, not a diagnosis. Blood tests and ultrasound provide confirmation.
Do darker lines always mean a healthy pregnancy?
No. Line progression can rise in normal pregnancies, but biology varies. Slow rises and temporary dips can occur. Some non-viable pregnancies may briefly rise. Use line trends with timing, symptoms, bloods and ultrasound.
How does DPO work if I only enter dates?
You can enter DPO directly, set an ovulation date for auto-DPO, or just enter test dates and times. If you mix DPO and dates, the tool infers a common axis so points can be compared on one timeline.
I had an hCG trigger shot. Will it affect my results?
Yes. Early positives up to about ten to fourteen days after a trigger can be from the injection. Record the trigger date and time in Advanced options and continue testing every forty eight hours until the trend is clear.
What about evaporation lines or reading the test late?
Always read within the time window on the box. Grey lines that appear later are not positives. If you are unsure, record zero and retest after forty eight hours with the same brand and similar hydration.
Can a very high hCG cause a faint line?
Rarely, very high hCG can cause a “hook effect”. If a late test seems unexpectedly faint, repeat with a small dilution or choose a different brand, and consider a blood test if you need certainty.
How often should I test for a clear trend?
Every forty eight hours gives the clearest signal. Twenty four to thirty six hours can still show change, but daily testing adds noise and cost without much extra clarity.
Do digital tests work here?
Digital tests often have higher detection thresholds. You can log them, but strips with printed lines are better for day-to-day progression. If you mix types, keep brand and timing notes consistent.
Does this page store my data?
No. Everything runs in your browser. Nothing is sent to a server from this tool.
Support if you have experienced a loss
Reading about miscarriage, stillbirth, or infant loss can be difficult. If you have experienced a loss, you do not have to use this calculator or read the statistics. You may find it more helpful to talk with your care team or a support organization.
In the United States, groups such as:
offer information and bereavement support. If you are elsewhere, your local health service or a pregnancy and baby loss charity may be able to guide you to support in your region.