
Reviewed by Dr. Grace Ramosena, MBChB on Jan 25, 2026
Use this hCG calculator with at least 2 beta-hCG blood test results to estimate doubling time or halving time, compare your rise with typical early-pregnancy ranges, and view a chart.
hCG trends can be useful context, but they cannot diagnose viability or miscarriage. For a separate week-by-week estimate, see the miscarriage risk calculator.
What your results actually mean in real life
| Badge | What it usually means | Next step |
|---|---|---|
| Faster than typical | Often seen in healthy singleton or twin pregnancies | Keep following your clinician's testing and follow-up plan. |
| Within typical range | Often falls within published early-pregnancy reference patterns | Keep following your clinician's testing and follow-up plan. |
| Slower than typical or Very slow rise | A slower rise can occur in a viable pregnancy, but the trend alone cannot establish the outcome. | Contact your clinician about the rise; they can advise on repeat tests and ultrasound. |
| Declining trend | Often (but not always) indicates pregnancy loss | Contact your doctor today - they can guide next steps |
This badge describes your hCG trend. It cannot confirm viability or tell you which follow-up you need. Follow your clinician's advice even when the result is within the typical range.
Looking for a different hCG calculator?
If you only have a single lab value or you’re expecting multiples, these tools are a better match than the Doubling Time (with Chart) calculator. Try Beta hCG: How Many Weeks Pregnant? or hCG Doubling Time for Twins/Triplets.
Beta hCG: How Many Weeks Pregnant?
Enter one value to see your likely week and the full typical hCG ranges by week.
hCG Doubling Time: Twins/Triplets
Calculate doubling time for multiples with a 48-hour projection and log-scale chart.
How to use this calculator
- Enter your draws: type the exact date/time and hCG value for at least two draws. Use the same lab if possible.
- Add more points (optional): click "Add another draw" to include extra results. Wider gaps of 24-48 hours are most useful.
- Set a projection (optional): choose a future date/time or leave blank to project +48 h from the last draw.
- Calculate: press Calculate to see the doubling time, a quick context badge, the projection value, and a chart.
How to read the chart
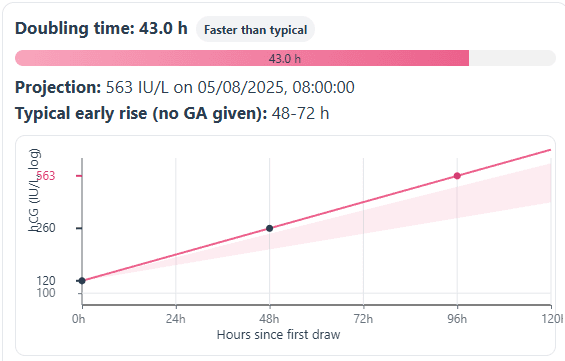
- X-axis: hours since the first draw.
- Y-axis: hCG (IU/L) on a log scale, so equal vertical steps mean equal percent change.
- Shaded band: a broad comparison range selected from the latest hCG level. It is not a diagnostic threshold.
- Dark points and pink line: your measured draws and the line connecting them.
- Projection point: the predicted hCG at the chosen time. The result notes show the projected value and gestational age context when available.
- Badge and bar: classifies the rise as Faster than typical, Within typical, Slower than typical, or Declining. The bar fills more with shorter doubling times.
Educational tool only. It does not diagnose any condition and does not replace a clinician review.
hCG calculator: FAQs
How is hCG doubling time calculated?
The tool calculates the logarithmic rate for each consecutive pair of results. The headline doubling or halving time uses the latest two valid draws, while earlier intervals are listed separately so you can compare how the rate changed.
What is a typical doubling time in early pregnancy?
This calculator uses broad comparison ranges based on the latest hCG level: 48-72 h below 1,200 IU/L, 72-96 h from 1,200 to 6,000 IU/L, and 96-144 h above 6,000 IU/L. These are simplified context bands, not diagnostic cutoffs or published minimum rises. hCG alone cannot confirm viability.
How many draws do I need?
At least two. A third draw adds another interval, which can show whether the recent rate is changing. The calculator does not average all draws into one fitted result. Gaps of 24-48 h are usually the easiest to compare.
Does a slow rise always mean something is wrong?
No. hCG is one piece of information. Some viable pregnancies rise slower. Some non-viable cases can rise faster. Trends are interpreted with timing and ultrasound.
Can I compare results from different labs or times of day?
Use the same lab when you can. Assays differ. Time-of-day effects are small compared with multi-day change, but consistency helps.
How accurate is the projection to a future date?
It assumes your recent rate continues. Biology varies. Treat the projection as a guide and follow your clinician's plan.
Why does the chart use a log scale?
hCG changes by percentages, not constant amounts. A log Y-axis turns equal percent changes into equal steps, so slopes reflect rate cleanly over wide ranges.
Methodology
Purpose of this tool
This calculator describes how quickly a series of blood hCG results is rising or falling over time. It estimates a doubling time (for rising trends) or halving time (for falling trends), then compares that value with broad reference bands for early pregnancy. It does not diagnose ectopic pregnancy, miscarriage, or trophoblastic disease.
How the doubling or halving time is calculated
The model treats early hCG change as an exponential process and uses log values:
- Sorting and cleaning: All entered draws are sorted by date and time. Only rows with a valid date, time, and positive hCG value are used.
- Log rise model: Each value is converted to the natural logarithm of hCG and plotted against hours since the first draw.
- Two draws: For exactly two points, the slope
kis the log change divided by the time gap. Doubling time isln(2) ÷ khours. - Three or more draws: Each consecutive pair is calculated separately. The latest valid pair supplies the headline doubling or halving time, projection, and badge. Earlier intervals remain visible for comparison.
- Flat or falling values: If
kis zero within rounding, the result is reported as no rise. Ifkis negative, the tool reports a halving time instead of a doubling time.
Typical rise bands by level
Published studies show that hCG rise tends to slow as the starting level increases. The cutoffs and hour ranges below are broad comparison ranges. They are not clinical viability thresholds:
- Lower hCG levels: Below about 1,200 IU/L, The calculator uses 48 to 72 hours as a broad comparison band.
- Mid-range levels: From about 1,200 to 6,000 IU/L, The calculator uses a wider 72 to 96 hour comparison range.
- Higher levels: Above about 6,000 IU/L, The calculator uses 96 to 144 hours for comparison because rises commonly slow at higher levels. This band does not establish that a pregnancy is uncomplicated.
- Badge wording: The summary badge uses the latest interval. It reads declining when that interval falls; otherwise it compares the latest interval with the level-matched comparison range. A badge is context, not a diagnosis.
Projection and chart
The tool can project an expected hCG value at a future date and time:
- Projection: The chosen projection time is calculated from the latest interval rate, starting from the last measured value. If no time is entered, the calculator uses 48 hours after the last draw.
- Chart: The chart uses a logarithmic Y axis (IU/L) and shows hours since the first draw on the X axis. A shaded area shows the level-matched comparison range.
- Progress bar: A simple bar maps doubling or halving times between about 24 and 192 hours onto a 0 to 100 percent scale to give quick context.
Data entry tips
To make the output easier to interpret:
- Use the exact report date and time for each blood test when possible.
- Try to keep gaps between tests around 24 to 48 hours. Very short or very long intervals make trends harder to interpret.
- Later in the first trimester, natural slowing of hCG means that longer doubling times can still be normal.
Limitations
Serial hCG patterns are only one part of early pregnancy assessment. Laboratory variation, biological variation, and differences between assays can shift values. Atypical rises or falls can be seen with viable intrauterine pregnancies, early pregnancy loss, or ectopic pregnancy. This calculator does not confirm or exclude any of these conditions and is not a substitute for clinical assessment and ultrasound.
Sources we used
These sources support the broad pattern of hCG change and its clinical limitations. These broad comparison ranges provide context for interpreting the result. Doubling time alone cannot determine viability or pregnancy location.
- Hendriks E, MacNaughton H, Mackenzie MC. "First Trimester Bleeding: Evaluation and Management." American Family Physician. 2019. aafp.org.
- Anderson J, Ghaffarian KR. "Early Pregnancy Diagnosis." StatPearls. NCBI Bookshelf. ncbi.nlm.nih.gov.
- Barnhart KT, et al. "Differences in Serum Human Chorionic Gonadotropin Rise in Early Pregnancy by Race and Value at Presentation." Obstetrics & Gynecology. 2016. PubMed.
- Larrain D, Caradeux J. "Beta-Human Chorionic Gonadotropin Dynamics in Early Gestational Events: A Practical and Updated Reappraisal." Obstetrics and Gynecology International. 2024. PMC.
- National Institute for Health and Care Excellence (NICE). NG126: "Ectopic Pregnancy and Miscarriage: Diagnosis and Initial Management." nice.org.uk.
Support if you have experienced a loss
Reading about miscarriage, stillbirth, or infant loss can be difficult. If you have experienced a loss, you do not have to use this calculator or read the statistics. You may find it more helpful to talk with your care team or a support organization.
In the United States, groups such as:
offer information and bereavement support. If you are elsewhere, your local health service or a pregnancy and baby loss charity may be able to guide you to support in your region.
Medical disclaimer
The information and calculators on this site are educational tools only. They provide statistical estimates based on published research and the details you enter.
They cannot diagnose, predict what will happen for you, or replace personalized advice from a licensed health care professional who knows your full history. Always talk with your doctor, midwife, or other qualified clinician before making decisions about your health, fertility, or pregnancy.
Never ignore, avoid, or delay seeking professional medical advice because of something you read here or a result you see in a calculator. If you think you may be having a medical emergency, call 911 in the United States or your local emergency number.